Models of NAFLD/NASH
Nonalcoholic fatty liver disease (NAFLD) represents the hepatic manifestation of obesity and metabolic syndrome. Nonalcoholic steatohepatitis (NASH), a severe form of NAFLD, can further progress to fibrosis, cirrhosis and hepatocellular carcinoma (HCC). Greentech Bioscience offers a complete, validated animal model library of NAFLD and NASH for drug efficacy testing.
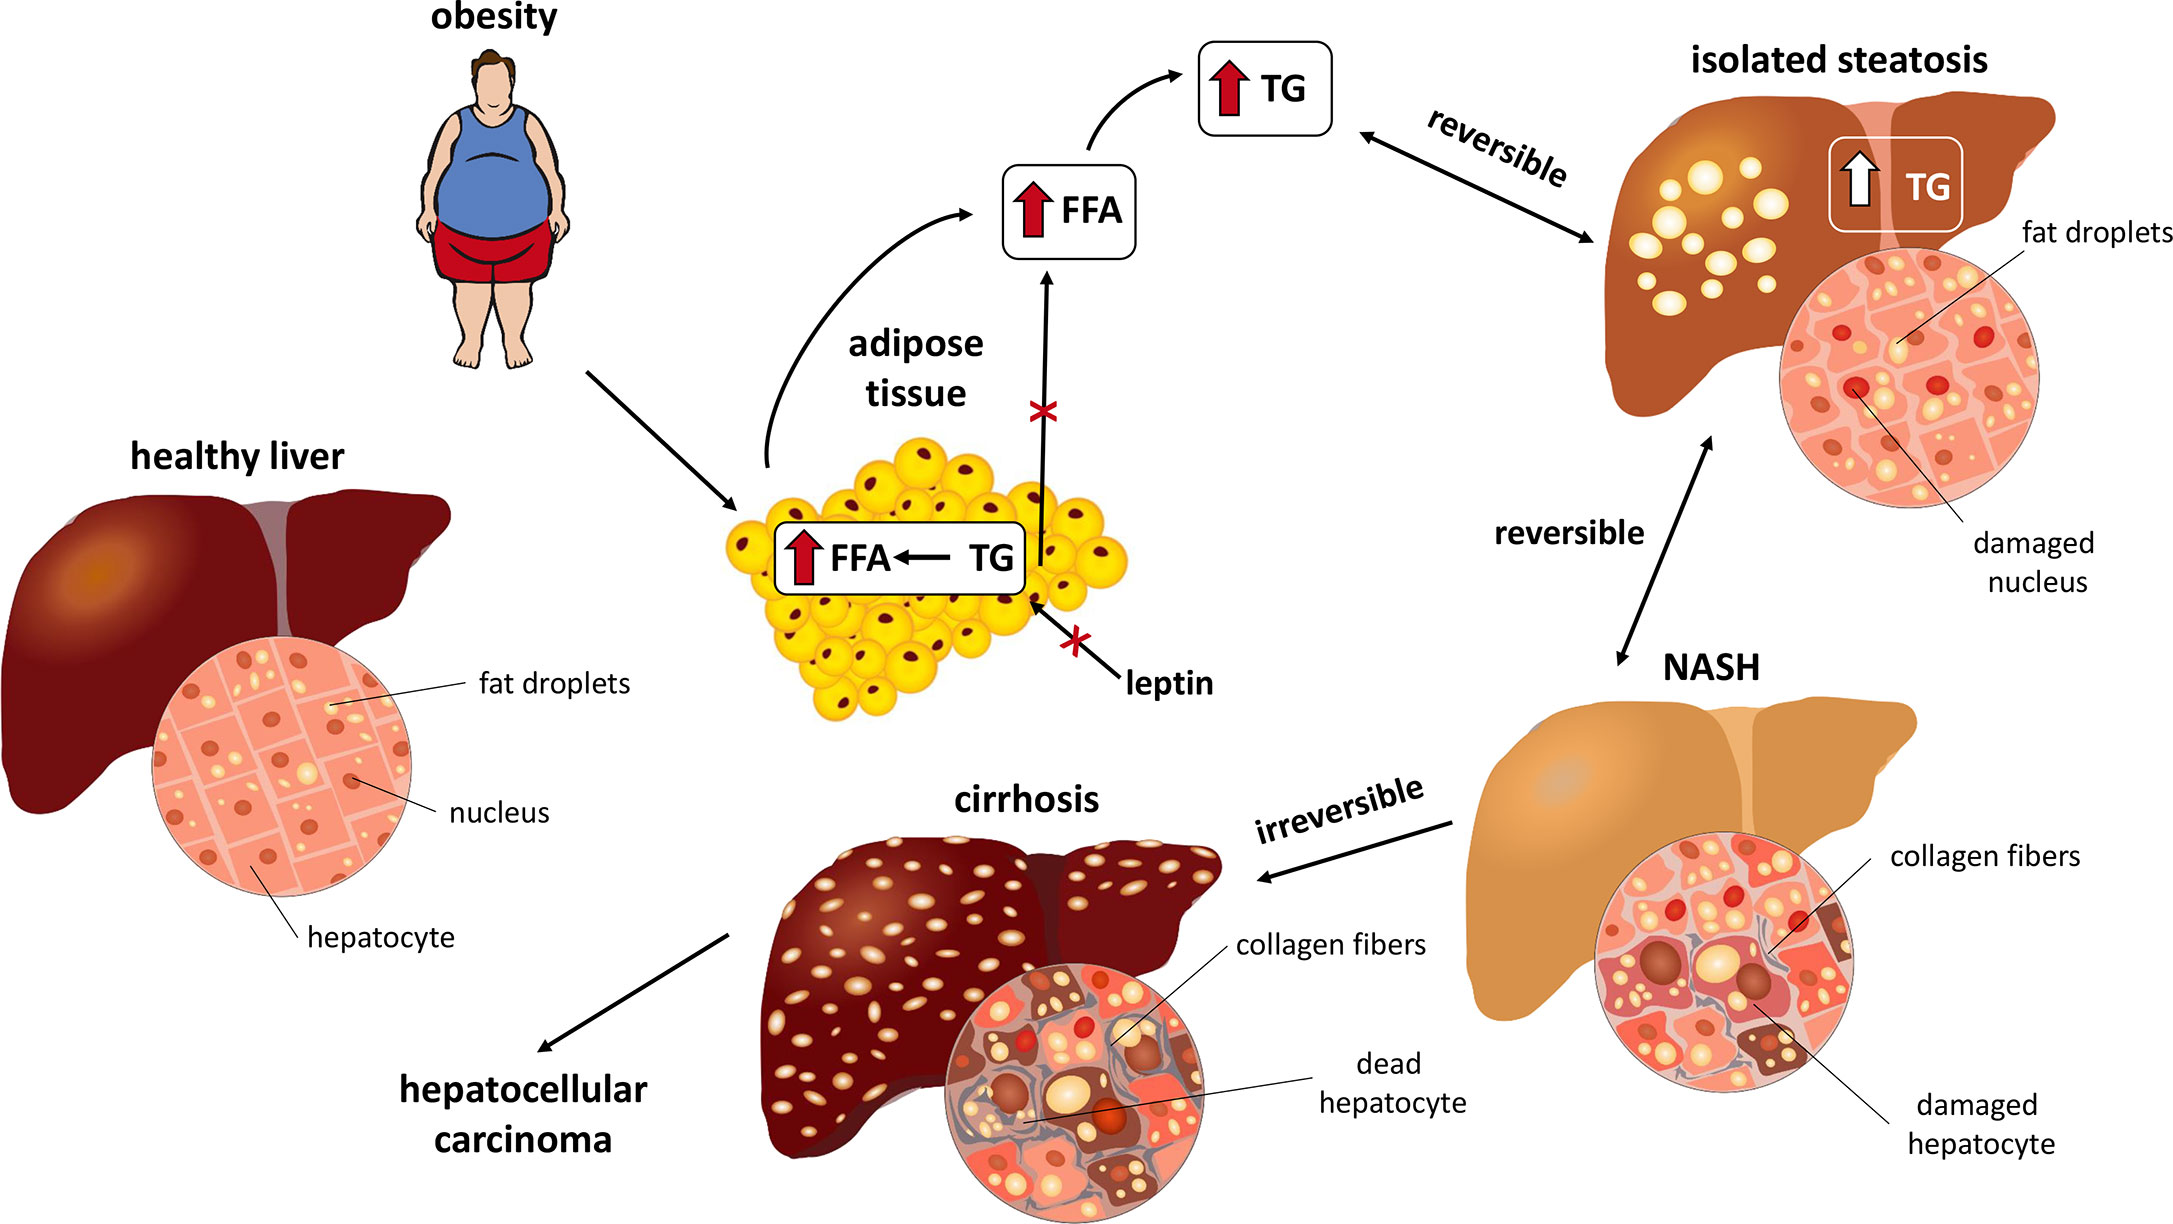
Figure 1. Stages of NASH (Kořínková et al. 2020).
Animal Models of NAFLD/NASH
Greentech provides multiple animal models of NAFLD/NASH, and select the animal model that best conforms to your study aim. Our models are classified into nutritional models (or diet models), drug-induced models and combination models of drug and diet induced.
Table 1. NAFLD/NASH models at Greentech Bioscience.
Models | Species | Induction | Induction Period |
MCD/CDAA Model | C57BL/6 mice | Methionine- and choline-deficient diet | 6~8 weeks |
HFD Model | Mice, rats | High-fat diet | 20~30 weeks |
HFD+CCl4 Model | SD rats | High-fat diet + CCl4 induction | 12 weeks |
HFD+STZ Model | SD rats | High-fat diet + STZ induction | 10~12 weeks |
CCl4 Model | Mice, rats | CCl4 induction | 6 weeks |
STAM Model | Neonatal mice | High-fat diet + STZ induction | 8~10 weeks |
Western Diet Model | Mice, rats | High-fat, high-fructose, high-cholesterol diet | 12~16 weeks |
| Gan Diet Induced NASH Model | Mice | Gan Diet | 26 weeks |
Clinical Assessment
(1) Body weight, liver index, food intake;
(2) Liver function: ALT, AST, ALP;
(3) Lipid metabolism: TC, HDL, LDL, TG, and T-BIL in the blood serum; TC and TG in the liver tissue;
(4) Blood glucose and insulin: GLU, INS, HOMA-IR;
(5) Hepatic histopathology: HE, MASSON, Oil Red O, Sirius Red staining;
(6) Fibrosis: detection of collagen and hydroxyproline.
Case Study
1. MCD diet induced mouse model of NASH


Figure 2. Liver histopathology of mouse NASH models induced by MCD diet feeding for 6 weeks. The MCD diet is a classical mouse model of NASH still frequently employed in studies.
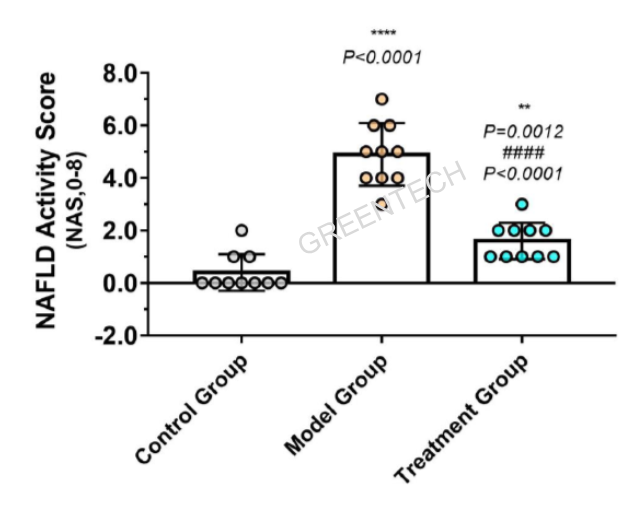
Figure 3. NAFLD activity score (NAS) of NASH in mice induced by an MCD diet.
2. Mouse model of CDAA diet induced NASH

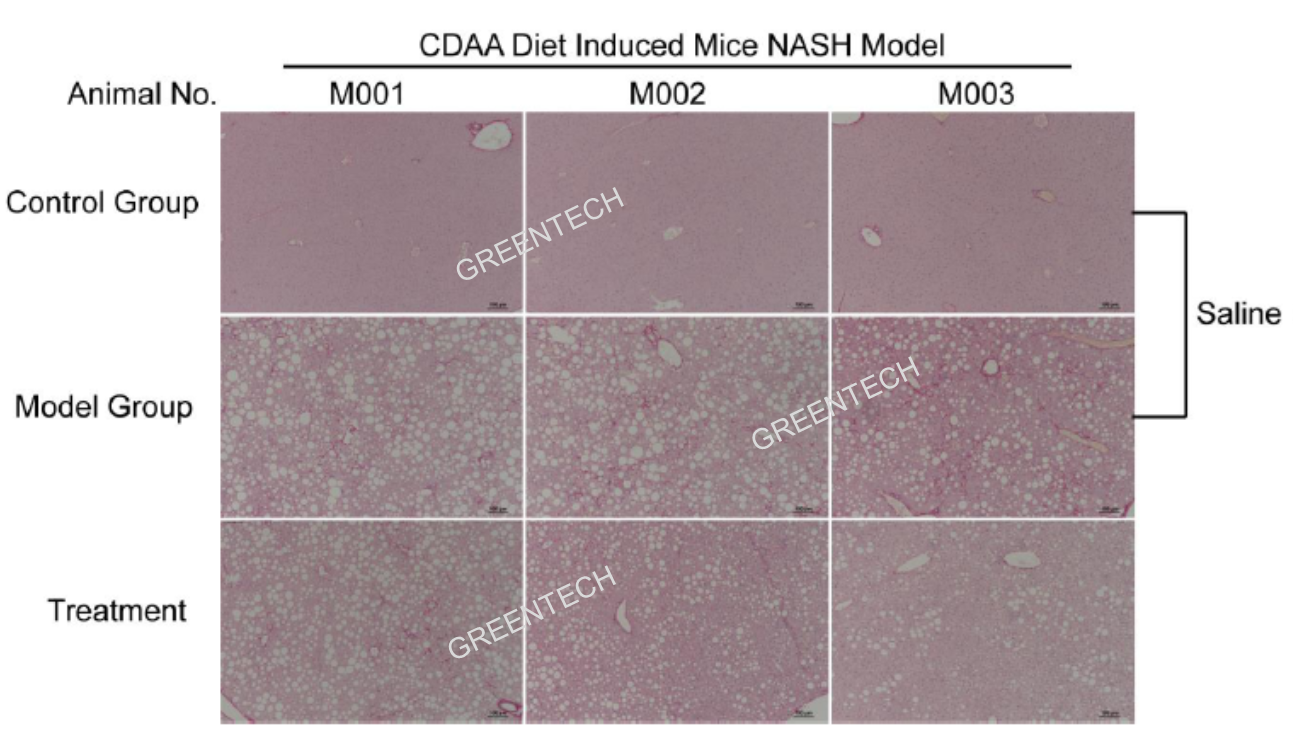
Figure 4. Liver histopathology of rodent NASH models induced by CDAA diet feeding for 8 weeks.
3. HFD induced NASH model
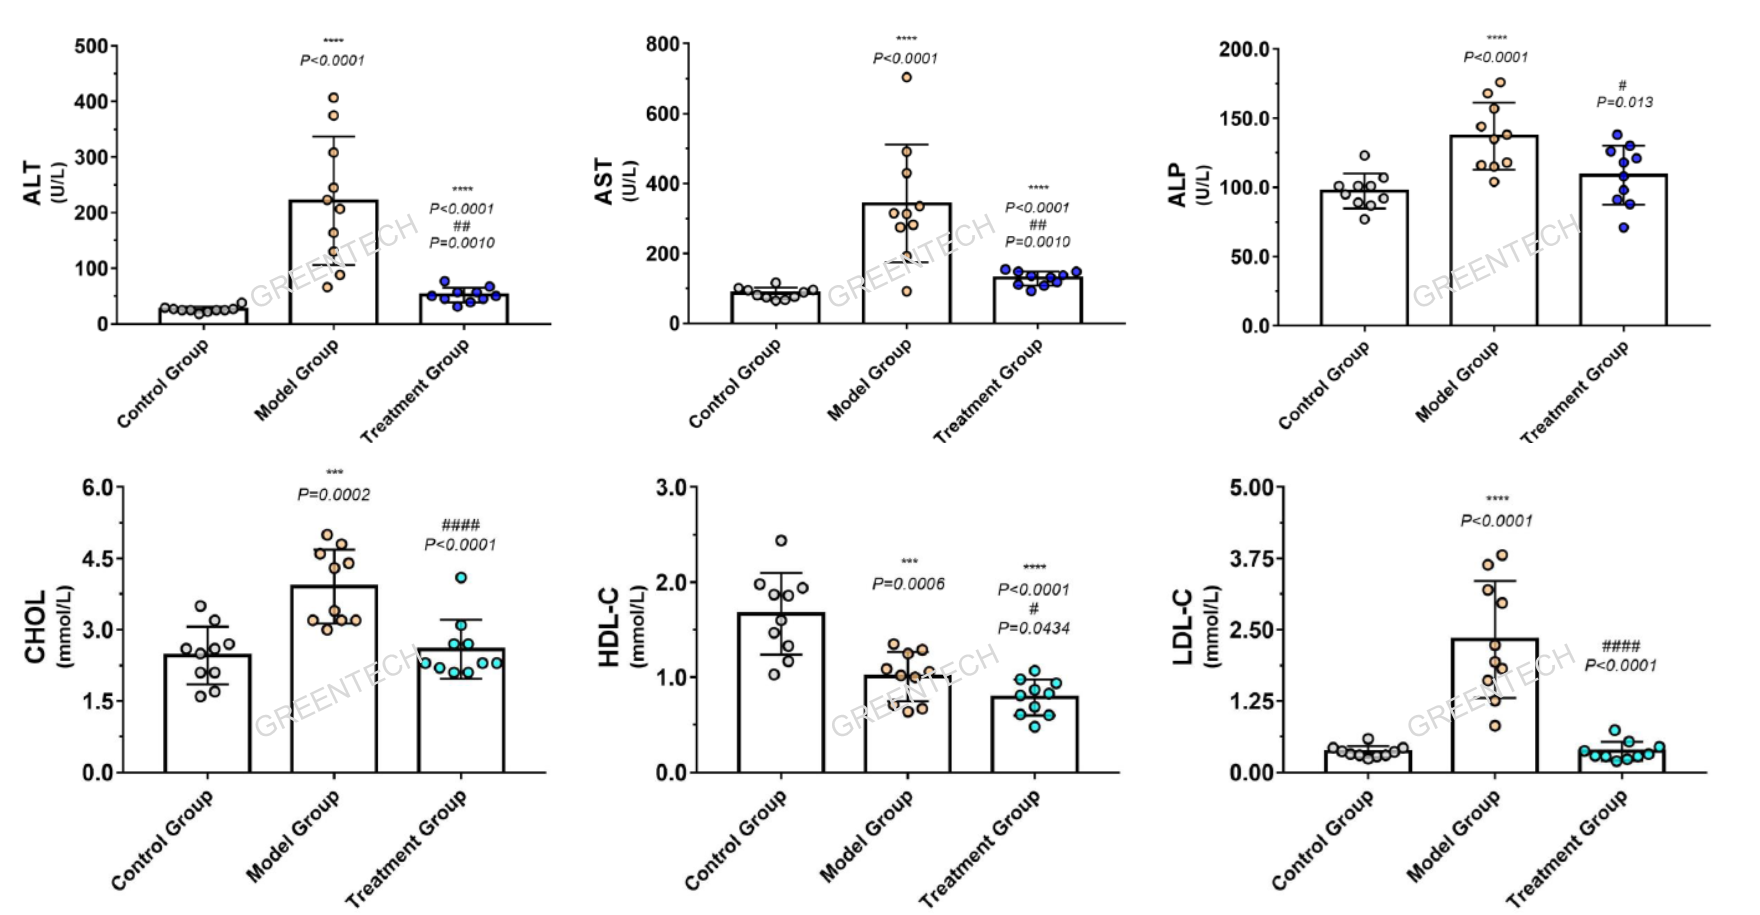
Figure 5. Blood biochemistry of induced by HFD feeding for 8 weeks.

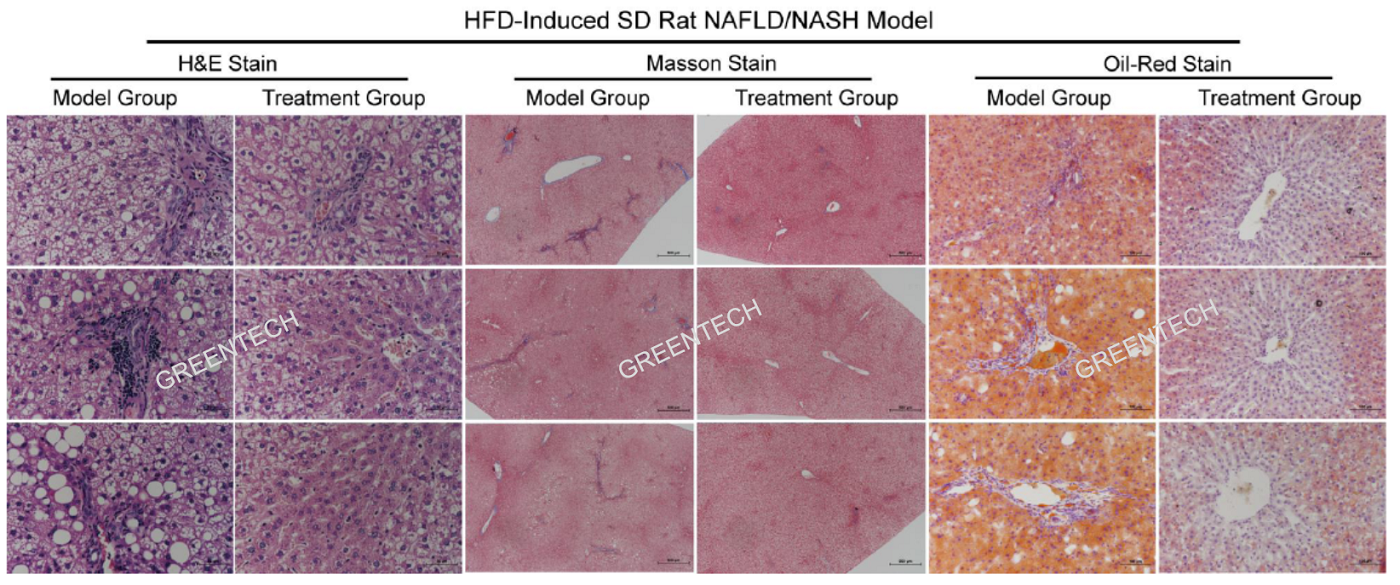

Figure 6. Liver histopathology of induced by HFD feeding for 12 weeks.

Figure 7. NAFLD activity score (NAS) and collagen volume fraction of NASH model induced by HFD feeding for 12 weeks.
4. CCl4 induced liver fibrosis model
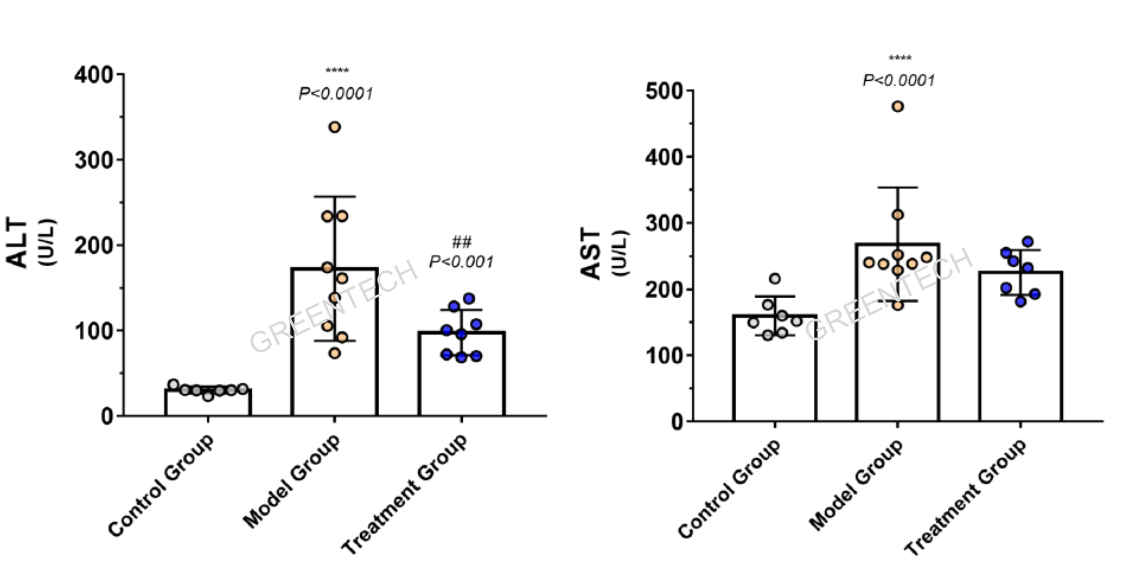
Figure 8. Liver function indices of liver fibrosis model induced by CCl4 injection for 6 weeks.

Figure 9. Liver histopathology of liver fibrosis model induced by CCl4 injection for 6 weeks.

Figure 10. Collagen volume fraction of liver fibrosis model induced by CCl4 injection for 6 weeks.
5. Western diet model
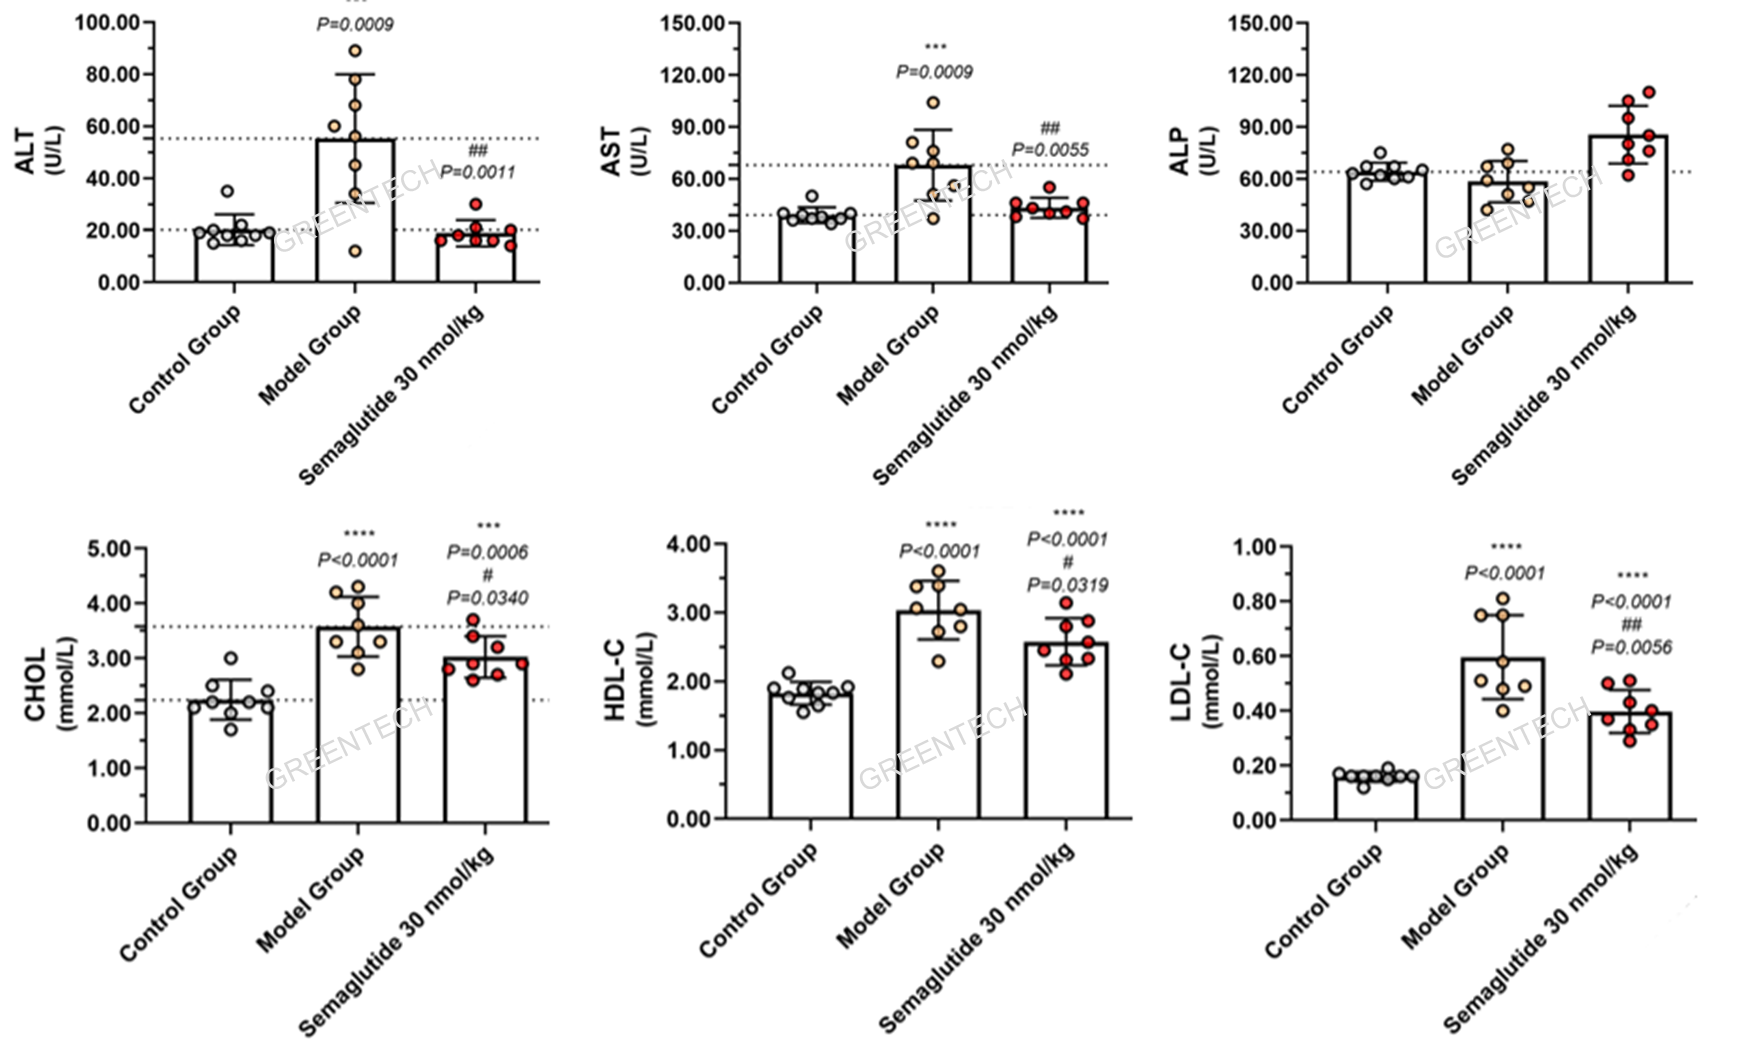
Figure 11. Blood biochemistry of Western diet model after 12 weeks of high-fat, high-fructose, high-cholesterol diet.

Figure 12. Insulin resistance occurs in Western diet models after 12-week feeding.


Figure 13. Liver histopathology of Western diet models after 12-week feeding.

Figure 14. NAS and fibrosis score of Western diet models after 12-week feeding.
6. Gan diet induced obese mouse NASH model
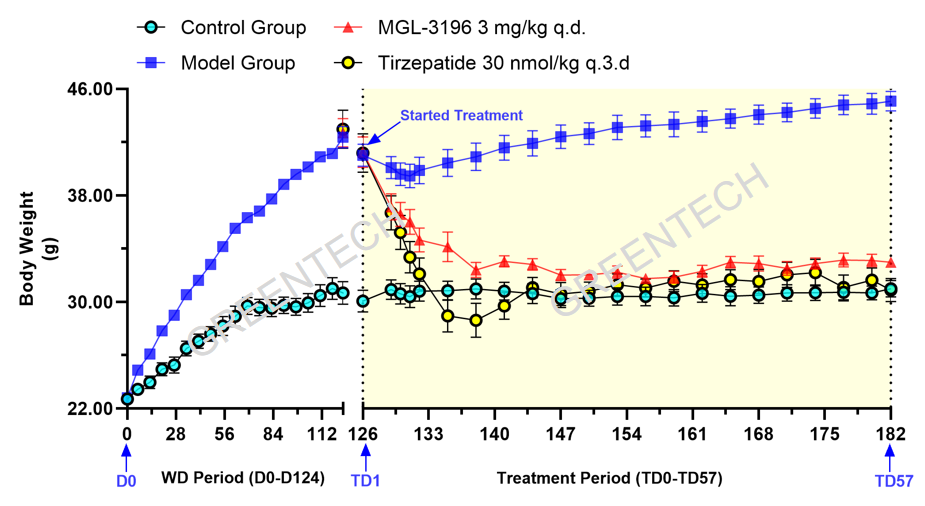
Figure 15. The Weight-Reducing Effects of THR-β Agonist MGL-3196 and GLP-1/GIP Receptor Agonist Tirzepatide in the Gan diet induced obese mouse model.

Figure 16. Lipid metabolism in the Gan diet induced obese mouse model.

Figure 17. Liver injury in the Gan diet induced obese mouse model.
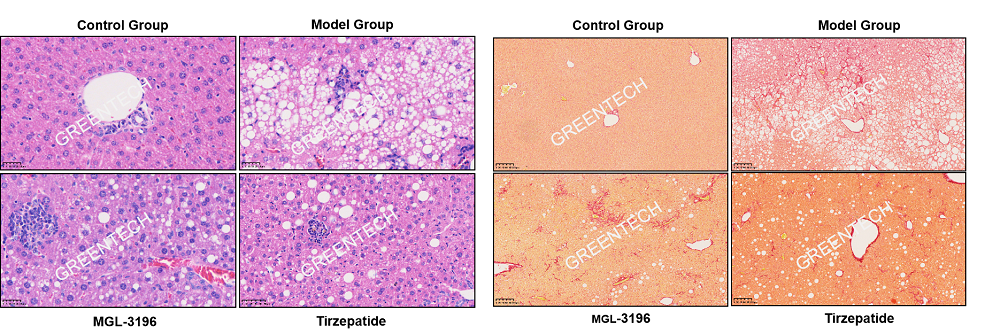
Figure 18. Hepatic histopathological alterations and fibrosis in the Gan diet induced obese mouse model.
References
1. Kořínková L, Pražienková V, Černá L, et al. Pathophysiology of NAFLD and NASH in Experimental Models: The Role of Food Intake Regulating Peptides[J]. Frontiers in Endocrinology, 2020, 11: 916.
2. Takuma Tsuchida, Youngmin A.Lee, Naoto Fujiwara, et al. A simple diet- and chemical-induced murine NASH model with rapid progression of steatohepatitis, fibrosis and liver cancer. Journal of Hepatology, 2018,69(2) :385-395.
3. Soret PA, Magusto J, Housset C, Gautheron J. In Vitro and In Vivo Models of Non-Alcoholic Fatty Liver Disease: A Critical Appraisal. J Clin Med. 2020 Dec 24;10(1):36. doi: 10.3390/jcm10010036. PMID: 33374435; PMCID: PMC7794936.
Inquiries
Request a quote now, or email us at BD@greentech-bio.com to inquire about our services or obtain a quote for your project.


